A Structured Retail Intelligence Platform

Turn Complex Retail Data into Clear Retail Intelligence.

The Retail Score creates a unified retail intelligence model from the systems that run your business — delivering automated reporting, deep analysis, AI-driven insight, and operational visibility so teams can understand performance and act faster.

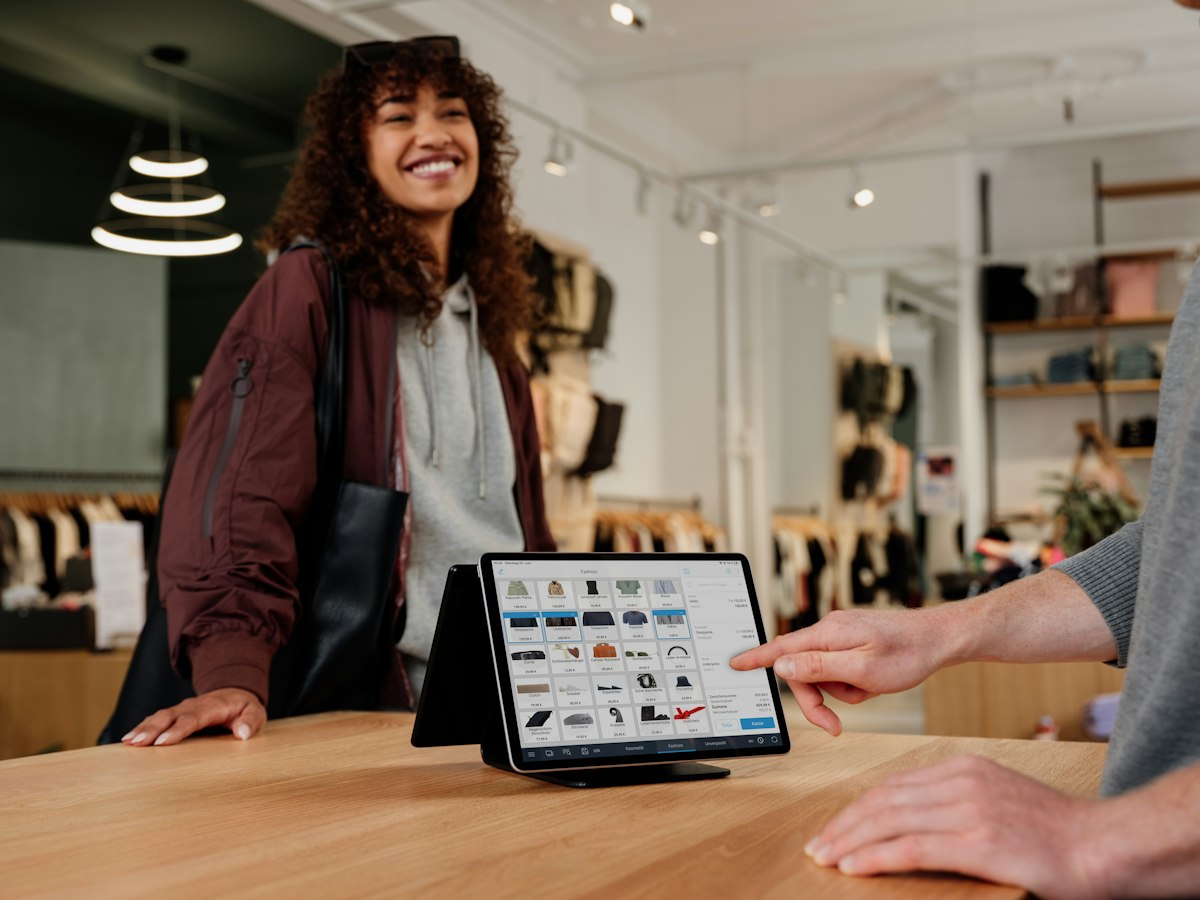
Shopper carrying bags from several stores Store assistant serving a customer with a tablet
tRS AI Unified Retail Intelligence Illustrative data

Our Clients

Cue Zimmermann Camilla Aje M.J. Bale Decjuba Sussan Macpac APG & Co Brand Collective Retail Apparel Group Global Retail Brands Early Settler Mr Vitamins

Unified Retail Intelligence
The Retail Score turns fragmented retail systems into a structured intelligence platform that powers reporting, analysis, AI, and execution.

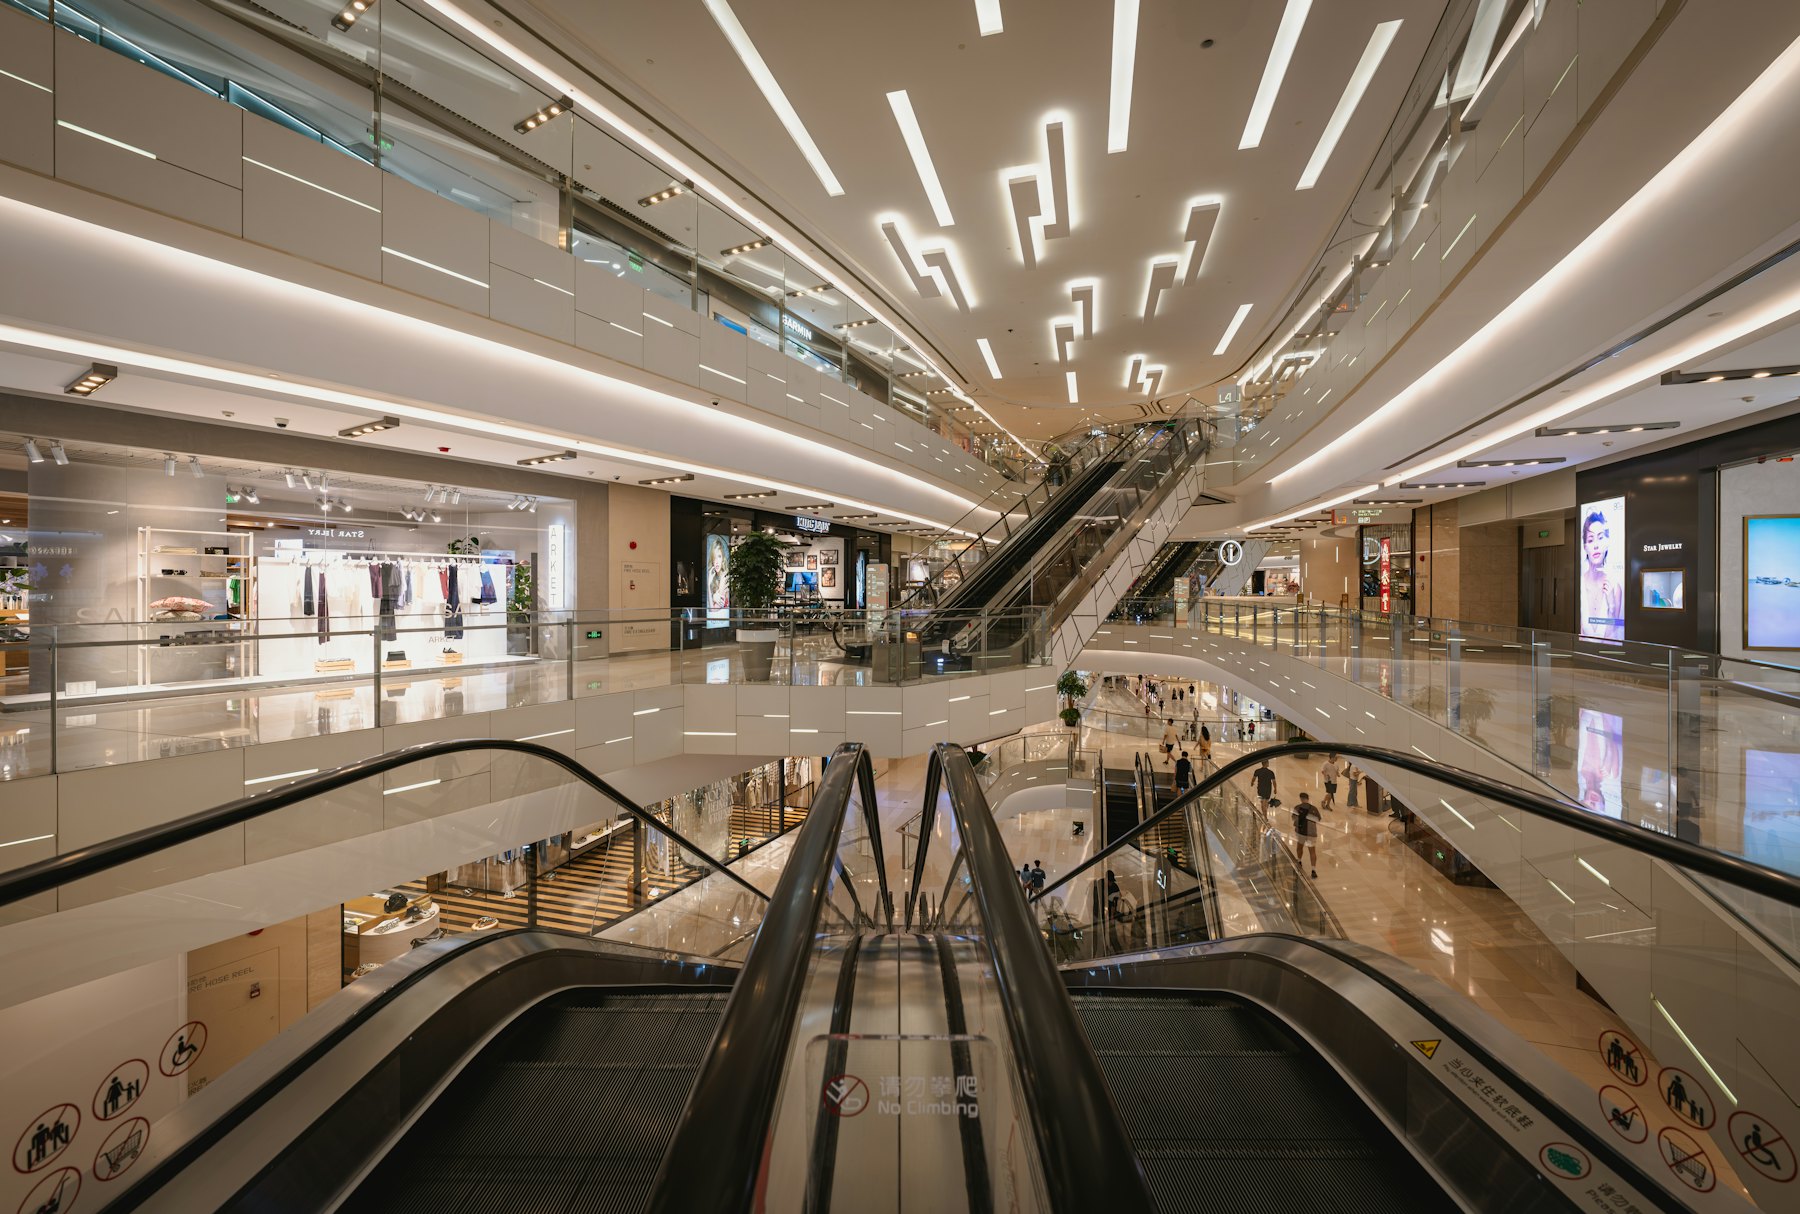
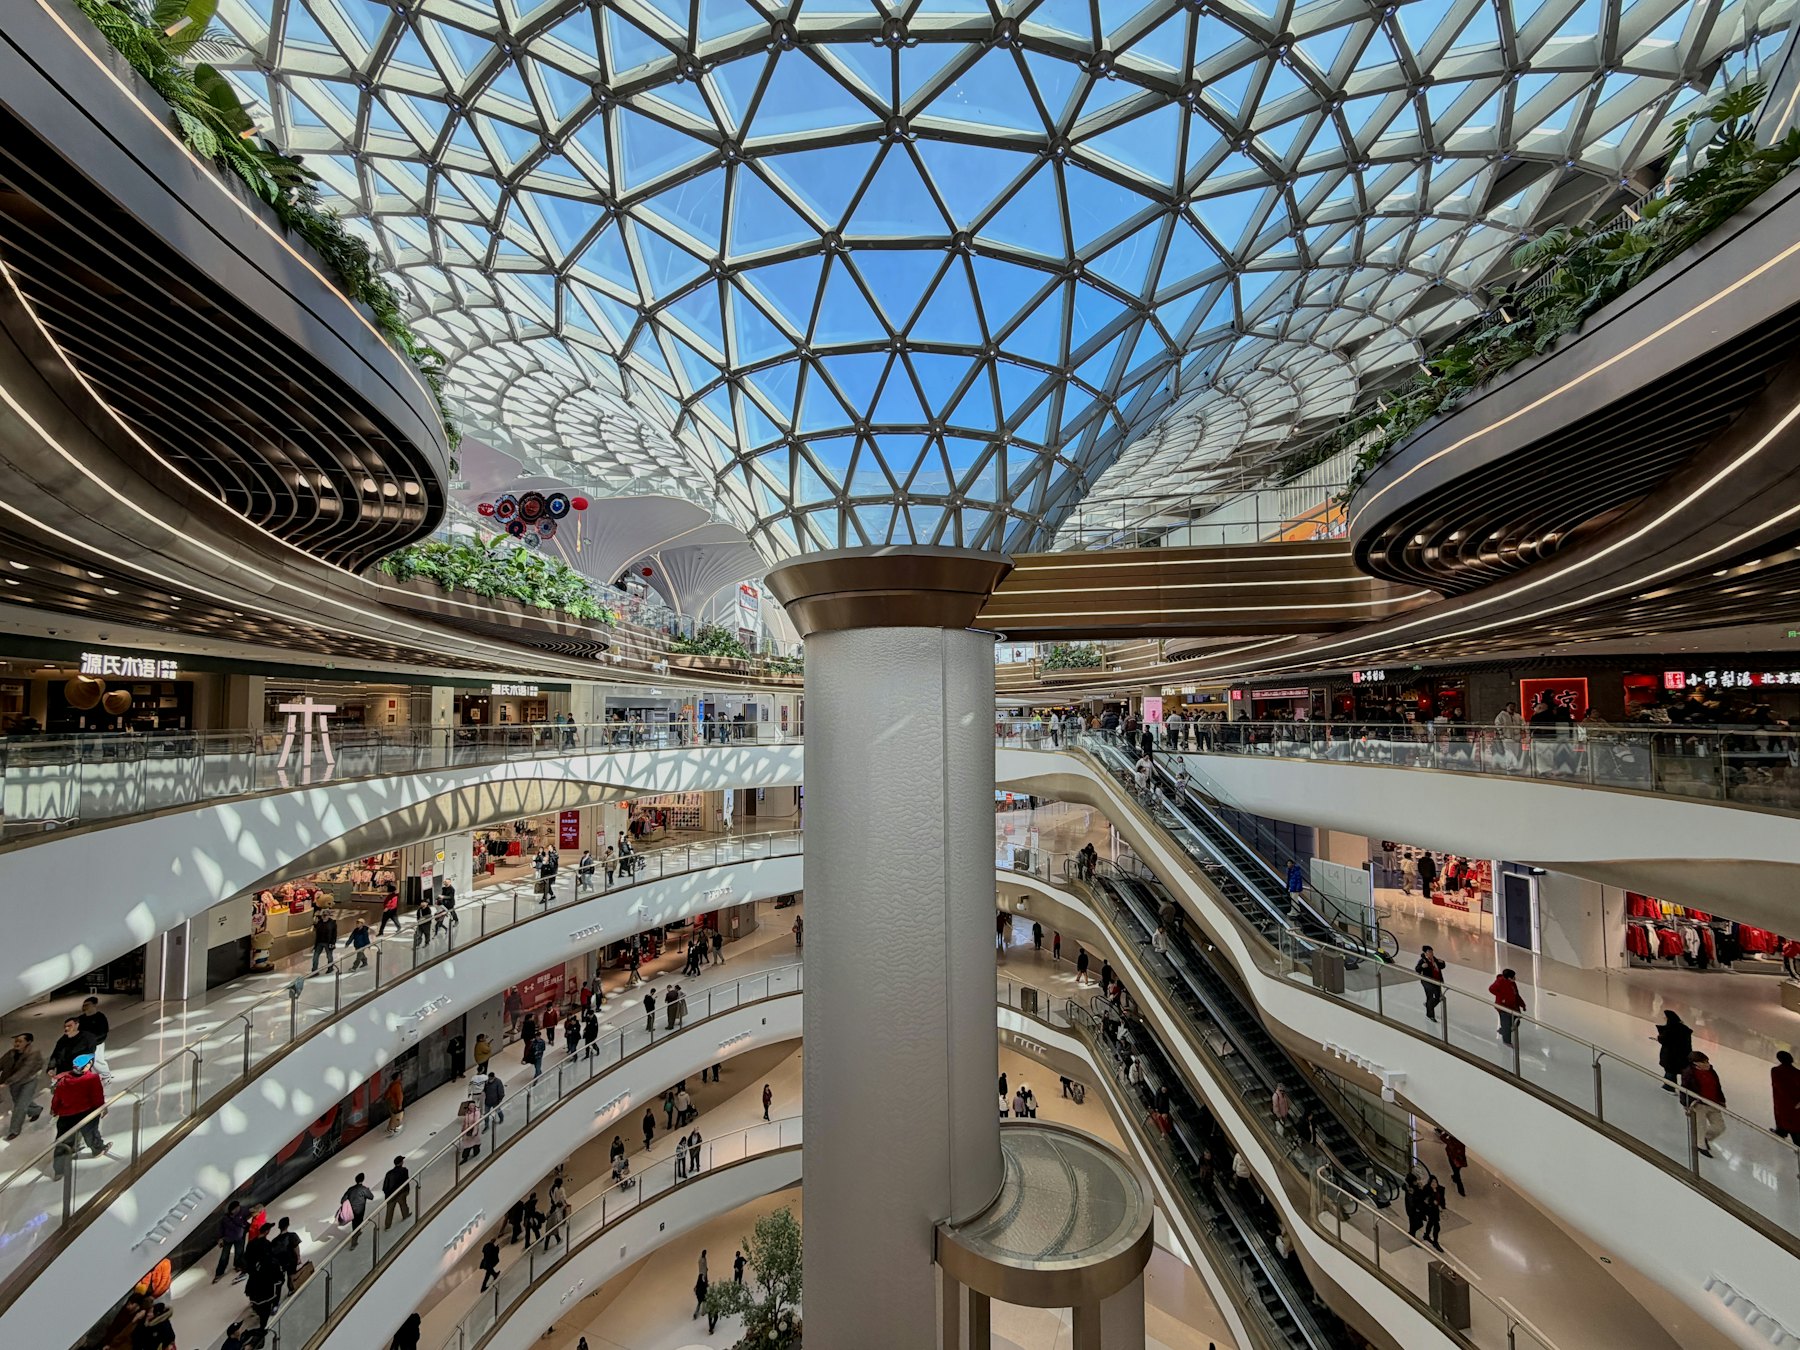
Modern shopping centre with escalators
Single source of retail data
Retail assistant helping a customer choose clothing
Store execution visibility
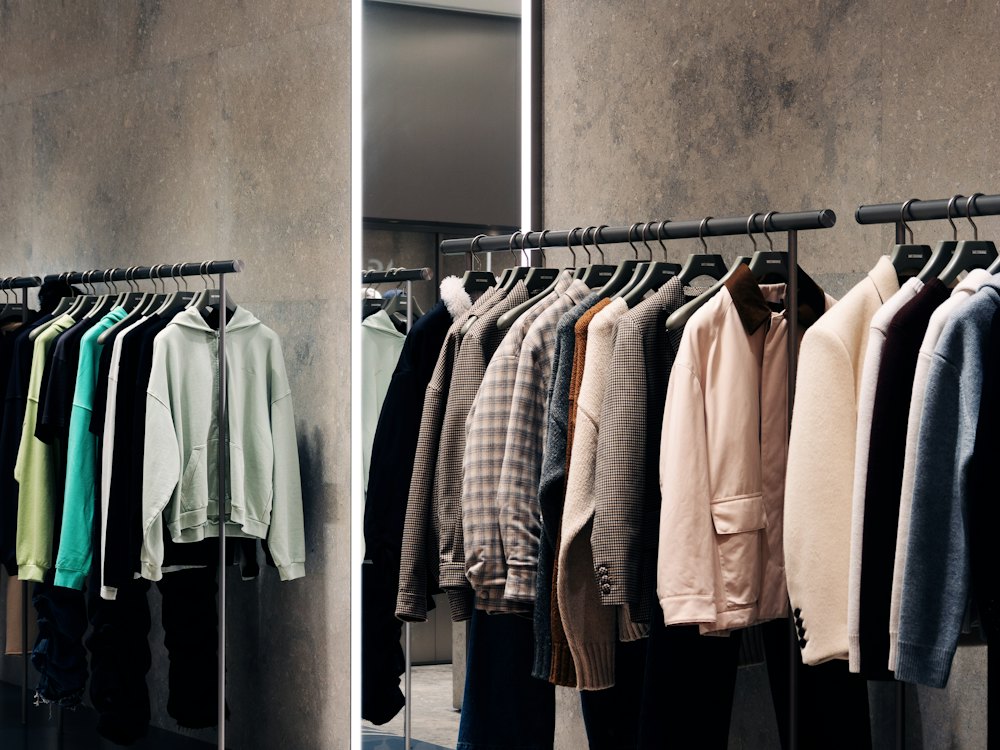
Jackets and shirts on a store clothing rack
Automated retail reporting
Head office team meeting around a conference table
AI operational insight

Retail systems create data. They do not create understanding.

Most retailers already have the data. The problem is that the relationships between sales, inventory, labor, finance, traffic, customers, and operations are spread across systems, reports, and teams.

tRS creates a clear, connected view of the business so retailers can move from disconnected numbers to faster reporting, sharper analysis, AI-driven issue detection, and better execution.

“What were sales last week?”
ERP$4.21MInvoiced, ex freight
POS$4.63MIncludes tax
Ecommerce$4.48MDemand, before returns
The Retail Score
Net sales$4.02M
One definition.
Every team.

Illustrative figures

From Retail Systems to Operational Execution

The Retail Intelligence Model transforms raw retail transactions into trusted business facts that power reporting, analysis, and AI.

Retail System

POSERPEcommerceInventoryTrafficMarketingMetaGoogleCustomerTime & AttendancePayrollSupply Chain

Retail Data Model

The Retail ScoreRetail Intelligence Model

  • Linked Retail EntitiesStores · Products · Customers · Channels · + more
  • Historical Business FactsPrice at sale · Cost history · Inventory history · + more
  • Consistent Retail DefinitionsDemand sales · Fulfilled sales · Net sales · + more
  • Clean Analytical DataFreight removed · Packaging removed · Exceptions handled · + more
  • Flexible Roll-UpsSKU → Category · Store → Region · Channel → Company · + more

Retail Intelligence
Automated ReportingTrusted reports delivered consistently across teams, channels, and levels of the business.
Simple Report CreationCreate and adapt reports quickly without rebuilding logic from scratch.
AnalysisSlice performance any way you need without rebuilding logic each time.
AI InsightsAI works from reliable business facts rather than fragmented operational data.

Source data flows in from across the business.

A structured retail data foundation that links raw transactions, preserves history, applies consistent definitions, and keeps analytical data clean.

Once the data is structured correctly, reporting, analysis, and AI all work from the same trusted foundation.

Retail Intelligence

Once the data is structured correctly, reporting, analysis, and AI all work from the same trusted foundation.

Last updated 18/11/2026 11:09
Today's budget69,497
Weekly target510,493
To make the week budget, you need to sell408,859

Retail year: Today · Relative period: WTD

Total business101,634
$ LY
163,022
Var $ LY %
−37.7%
Budget
193,960
Budget var %
−47.6%
Sales $101,634LY 163,022
Budget193,960Var % −47.6%
GP %69%LY 67%
Sales transactions1,022LY 1,585
ATV109LY 103
UPT3.1LY 3.1
Discount %29%LY 28%
% Sales $ (own label)81%LY 82%
Weeks cover22.9LY 22.8
ASP incl GST35.54LY 36.28
Net returns $ %−1.2%LY −1.2%
Traffic conversion %23.3%LY 22.4%
Week to date
Sales $101,634
Store sales budget $193,960
Sales $ LY163,022
Sales by hour Sales $ Sales $ LY
010k20k06:0010:0014:0018:0022:00
Day of weekStore sales budgetBudget var %Sales $ var LY
Monday59,809−32.3%−5,659
Tuesday64,653−20.5%−13,878
Wednesday69,497−86.0%−41,850
Thursday79,185−100.0%−51,689
Friday82,345−100.0%−57,426
Saturday96,877−100.0%−67,274
Sunday58,126−100.0%−42,535
ChannelAll
Area managerAll
Store gradeAll
TodayYesterdayLast weekLast month
DayWTDMTDQTDYTDMAT

Week of Wednesday 18/11/2026. Below are the nominated key performance indicators for the business.

Sales $9,720LY 51,571
Board budget sales $66,467Var −85%
Growth, var % LY−81.2%Var % LLY −75.8%
GP %70%LY 67%
# Trans97LY 557
Avg trans value110LY 93
Discount %26%LY 29%
% Own label sales75%LY 82%
Weeks cover22.9LY 22.8
ASP39.27LY 35.62
Net returns %−5.7%LY −1.5%
Traffic conv %0.0%LY 25.5%
Day
Sales $9,720
Board sales budget $66,467
Sales $ LY51,571
Sales $ LLY40,224
Week to date
Sales $101,634
Board sales budget $185,535
Sales $ LY163,022
Sales $ LLY111,479
Day of weekSales $Board sales budgetVar %
Monday40,51557,223−29%
Tuesday51,39961,845−17%
Wednesday9,72066,467−85%
Thursday75,712−100%
Friday78,577−100%
Saturday92,444−100%
Sunday55,466−100%

Top selling products (style colour codes) by sales $ for the selected period.

Maria Embroidered Linen Shirt White
Sales $6,384
Sales units48
ASP133.00
GP %68%
On hand units37
Weeks cover1.3
Estrella Top White
Estrella Top White
Sales $5,290
Sales units59
ASP89.66
GP %72%
On hand units146
Weeks cover10.7
Farrah Denim Short Ink
Sales $4,846
Sales units48
ASP100.96
GP %75%
On hand units98
Weeks cover3.8
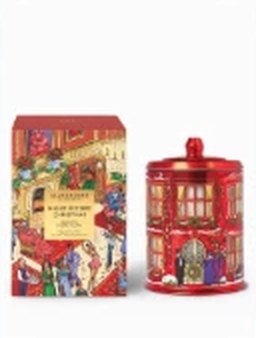
GF Candle Night Before Christmas X26
Sales $4,803
Sales units97
ASP49.52
GP %43%
On hand units351
Weeks cover9.0
Letticia Stripe Skirt Navy
Sales $4,739
Sales units44
ASP107.71
GP %64%
On hand units181
Weeks cover18.3
Sandy Top Sand
Sandy Top Sand
Sales $4,732
Sales units43
ASP110.05
GP %76%
On hand units110
Weeks cover5.2
Fernanda Pant Khaki
Fernanda Pant Khaki
Sales $4,043
Sales units31
ASP130.43
GP %83%
On hand units110
Weeks cover6.4
Marlowe Palma Bag Tan
Sales $3,970
Sales units68
ASP58.38
GP %72%
On hand units87
Weeks cover4.4
Michelle Linen Top Blue
Sales $3,772
Sales units28
ASP134.71
GP %75%
On hand units100
Weeks cover6.6
Lisbon Linen Pant Burgundy
Sales $3,663
Sales units30
ASP122.11
GP %69%
On hand units178
Weeks cover25.6

Results for your key location and product levels, linked to the page filters.

By region
Sales $Board budget $Var %Sales $ LYVar % LYDiscount %Own label %Weeks coverASP incl GST
Region 3 · Ella2,95110,060−71%7,583−61.1%17%59%16.346.37
Region 2 · Bianca2,25915,120−85%12,906−82.5%22%84%20.046.01
Region 1 · Sally1,48710,872−86%12,127−87.7%23%82%20.729.21
Region 4 · Katie1,2357,394−83%4,190−70.5%28%59%24.137.73
Grand total9,72066,467−85%51,571−81.2%26%75%22.939.27
By channel
Sales $Board budget $Var %Sales $ LYVar % LYDiscount %Own label %Weeks coverASP incl GST
Store7,93143,447−82%36,805−78.5%21%70%19.540.39
Wholesale1,0146,379−84%4,016−74.8%51%100%59.542.88
Online77611,471−93%10,750−92.8%23%93%17.328.12
Grand total9,72066,467−85%51,571−81.2%26%75%22.939.27

tRS Portal, shown with demo data

Run the business from one set of numbers.

Instead of spending time building, checking, and reconciling reports, teams can focus on understanding performance and taking action.

Automated Reporting

Trusted reports delivered consistently across teams, channels, and levels of the business.

Weekly trade reportDelivered Mon 6:00am
RegionNet salesvs budgetMarginTrend
NSW / ACT$1.42M+6.1%58.2%
VIC / TAS$1.18M+3.4%57.6%
QLD$0.86M−2.2%55.9%
Online$0.56M+11.8%61.4%

Simple Report Creation

Create and adapt reports quickly without rebuilding logic from scratch.

CompanyRegionStoreCategory
Dresses$312k
Knitwear$241k
Outerwear$183k
Accessories$112k

AI Insights

AI works from reliable business facts rather than fragmented operational data.

LaborLabor alert: 12 stores running >4% over wage target
InventoryInventory risk: 5 locations trending toward stockouts in the next 14 days
PerformanceSales performance: 18 stores missed weekly sales target

Analysis

Slice performance any way you need without rebuilding logic each time.

Storevs targetConv.Wage %
Chadstone31%14.2%On track
Bondi Junction27%15.1%On track
Pacific Fair22%18.9%Wages over
Rundle Mall19%15.6%Low conversion

Screens show illustrative data

tRS AI

AI that Works from Connected Retail Data

When retail data is connected through a consistent data model, AI can reason across the business instead of working from disconnected reports. This allows retailers to automate analysis, detect problems earlier, and answer complex operational questions much faster.

ClaudeChatGPTCopilotWhat's next
tRS AI
One source of truthConnected through Link AI
Validated dataDefinitionsCompany rulesToken-efficient extractionSecurity
POSERPEcommerceInventoryTrafficPayroll

Surface issues automatically

Continuously monitor performance across stores, products, inventory, labor, and finance to detect exceptions, emerging risks, and performance gaps.

Automate complex analysis

Work through multi-step business logic across sales, inventory, labor, and financial data to answer questions that normally require multiple reports.

Create repeatable AI workflows

Define analytical workflows once and apply them repeatedly across brands, regions, stores, and time periods to support consistent decision making.

Built for the Entire Retail Organization

The same data foundation supports executives, sales, operations, planning, finance, and ecommerce teams.

Imagine investigating

Primary Retail Segments We Serve

The Retail Score is used across retail, but two segments consistently drive the most value — multi-unit restaurant operations and fashion, footwear, and accessories retailers.

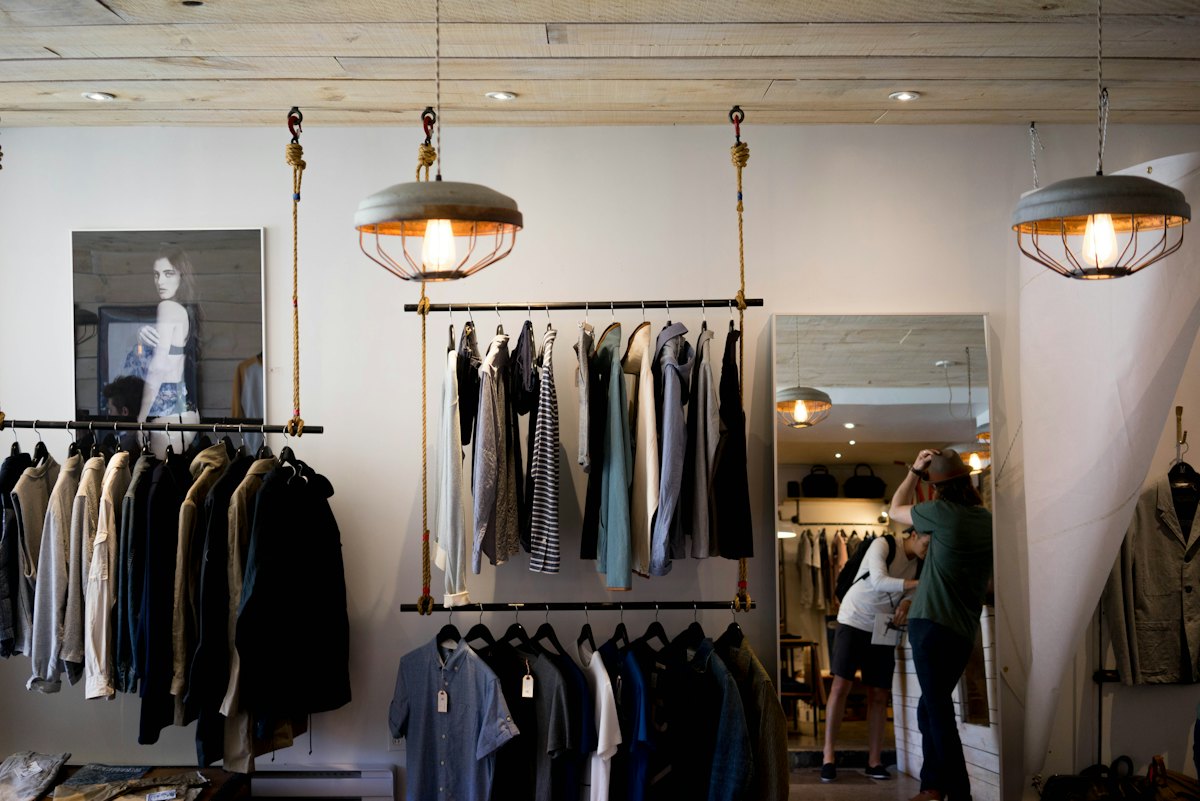
Clothing boutique interior with hanging racks

Fashion, Footwear & Accessories

Apparel and footwear retailers use tRS to connect merchandising, store, ecommerce, and financial data so the business can be managed as a whole.

Primary teams

Merchandise planningStore operationsFinance teams
Fashion, Footwear & Accessories →
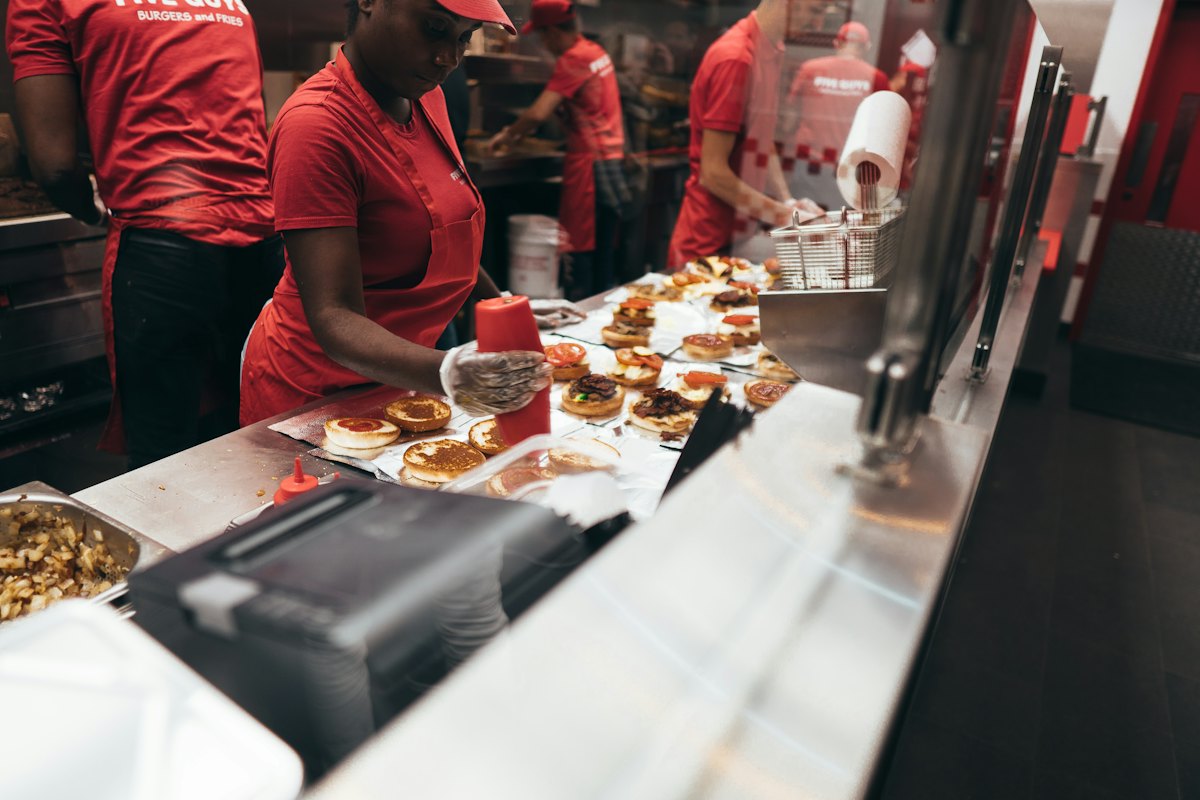
Restaurant crew preparing orders at a service counter

Quick-Service Restaurants

Multi-unit restaurant groups use tRS to integrate operational and financial data across all brands and locations.

Primary use cases

Enterprise leadership view across multiple brandsStore performance monitoringTerritory manager operational oversightLabor, sales, and execution performance
Quick-Service Restaurants →

Retail Data Handled with Enterprise-grade Security

Retail data is sensitive. The Retail Score platform is designed to protect it at every stage — from ingestion to reporting.

Customer data isolation

Each customer's data is isolated.

Secure cloud infrastructure

The platform runs on Microsoft Azure using high-availability, fault-tolerant infrastructure.

Controlled access

Role-based security ensures users only see the data they are authorized to access.

Encrypted backup & recovery

Data is backed up to encrypted geo-redundant storage with defined recovery procedures.

Retail decisions are easier when the data is connected.

The Retail Score turns fragmented retail systems into a structured intelligence platform that powers reporting, analysis, AI, and execution.
We focus on delivering a tangible return on investment be it through improved productivity, finding growth or aiding smarter decision-making. Collectively, we have over 50 years of experience in retailing, retail analytics, data management and insights.