tRS Cubed is a fast and powerful solution tailored for users who frequently work with data. We help retail decision-makers create their own reports and conduct ad hoc data queries. This tool allows users to extract data and construct reports directly from their own data warehouse. This allows them to leverage a robust data Cube connected through MS Excel Pivot Tables.
By analysing historical and trend data, tRS Cubed facilitates accurate forecasting and demand planning.
Our Key
Benefits
Features
Benefits
No Additional Software Needed
Access tRS Cubed via Microsoft Excel, eliminating the need for additional software licenses.
Become a Data-Driven Organization
The use of Excel eliminates training requirements and enables anyone to use the data, making it more useful and valuable.
Super-Fast Response Times
The use of Excel reduces training requirements.
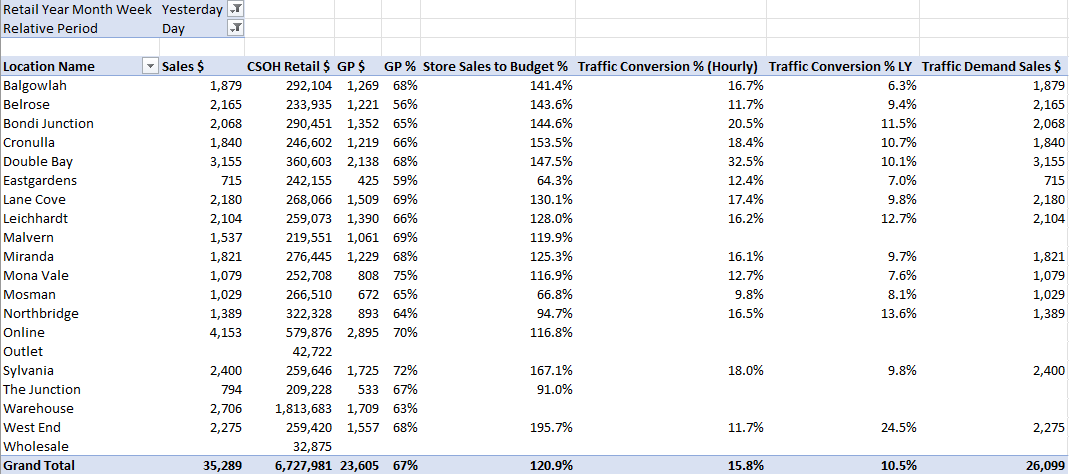
Report Shareability
Users can create and share up-to-date, data-driven reports, enhancing collaboration and informed decision-making across teams.
Secure Access
Manage user access through site-to-site authentication.
Features
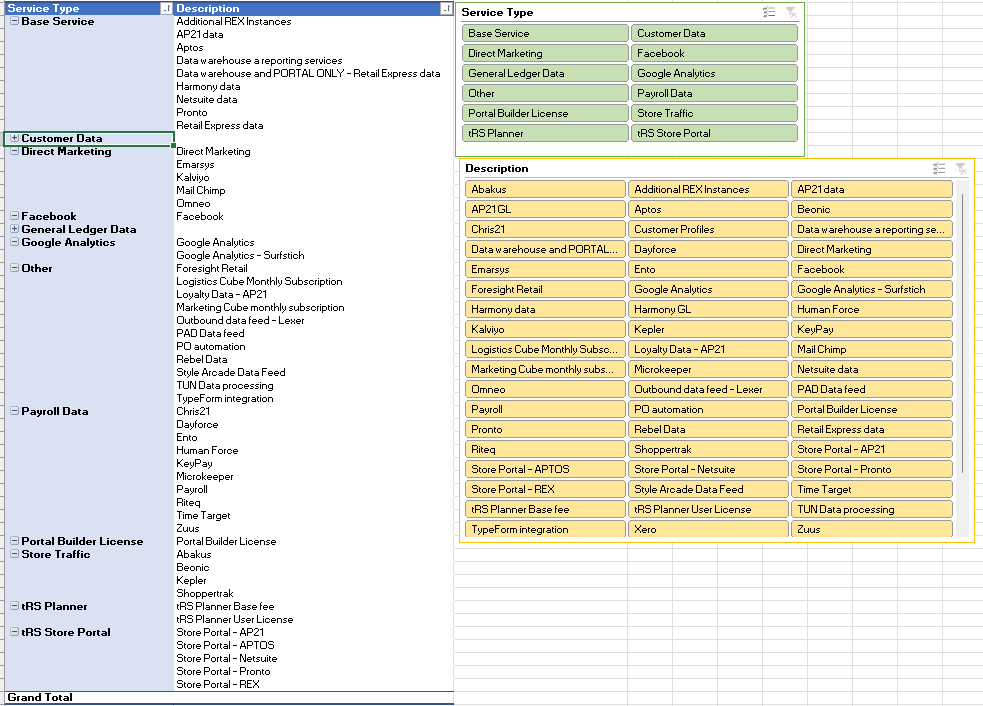
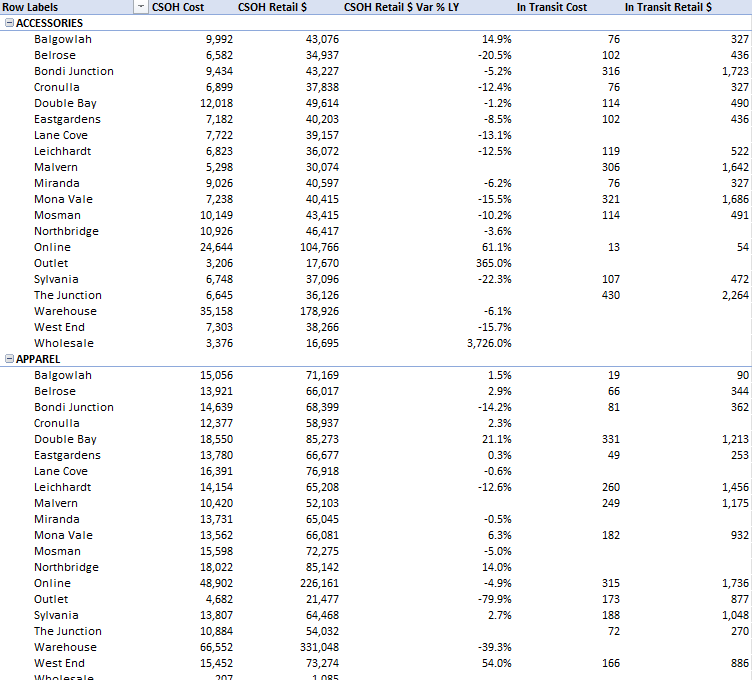
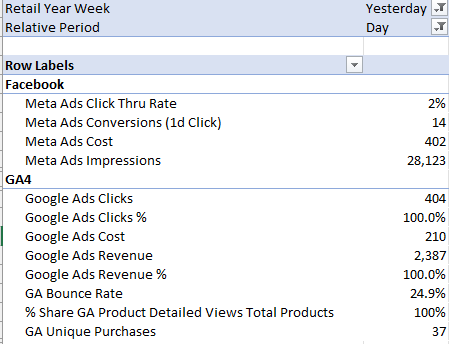
Direct Integration to Microsoft Excel Pivot Tables
Simply connect to the data source! User have full access to their integrated data, a common set of metrics, and all the capability of Excel.
Automatically Rerun Reports on Opening
Set your saved Excel reports to refresh each time they open, and utilize the rolling time ranges so you don’ t need to make any adjustments.
Export Data to Other Applications
Set up data extracts to automatically generate and transfer to other applications.
Populate Existing Reports
Reuse your existing Excel reports by mapping the fields in Cubed to the spreadsheet.
Explore the product
Know where to look to get the greatest return on your data insights.
We focus on delivering a tangible return on investment be it through improved productivity, finding growth or aiding smarter decision-making. Collectively, we have over 50 years of experience in retailing, retail analytics, data management and insights.