Weekly
Refreshed every Monday
Participating retailers' data is processed and published every Monday evening, so the Index always reflects the week just gone — not a quarter-old survey.
The tRS Retail Index
Built from weekly retailer data, the tRS Retail Index turns fragmented sales, traffic and margin data into a single, trusted benchmark for the clothing, footwear and accessories industry.
Every Monday evening the Index refreshes with like-for-like sales, transaction values, discounting depth and channel performance — reported nationally, by region, and down to individual postcodes and precincts.
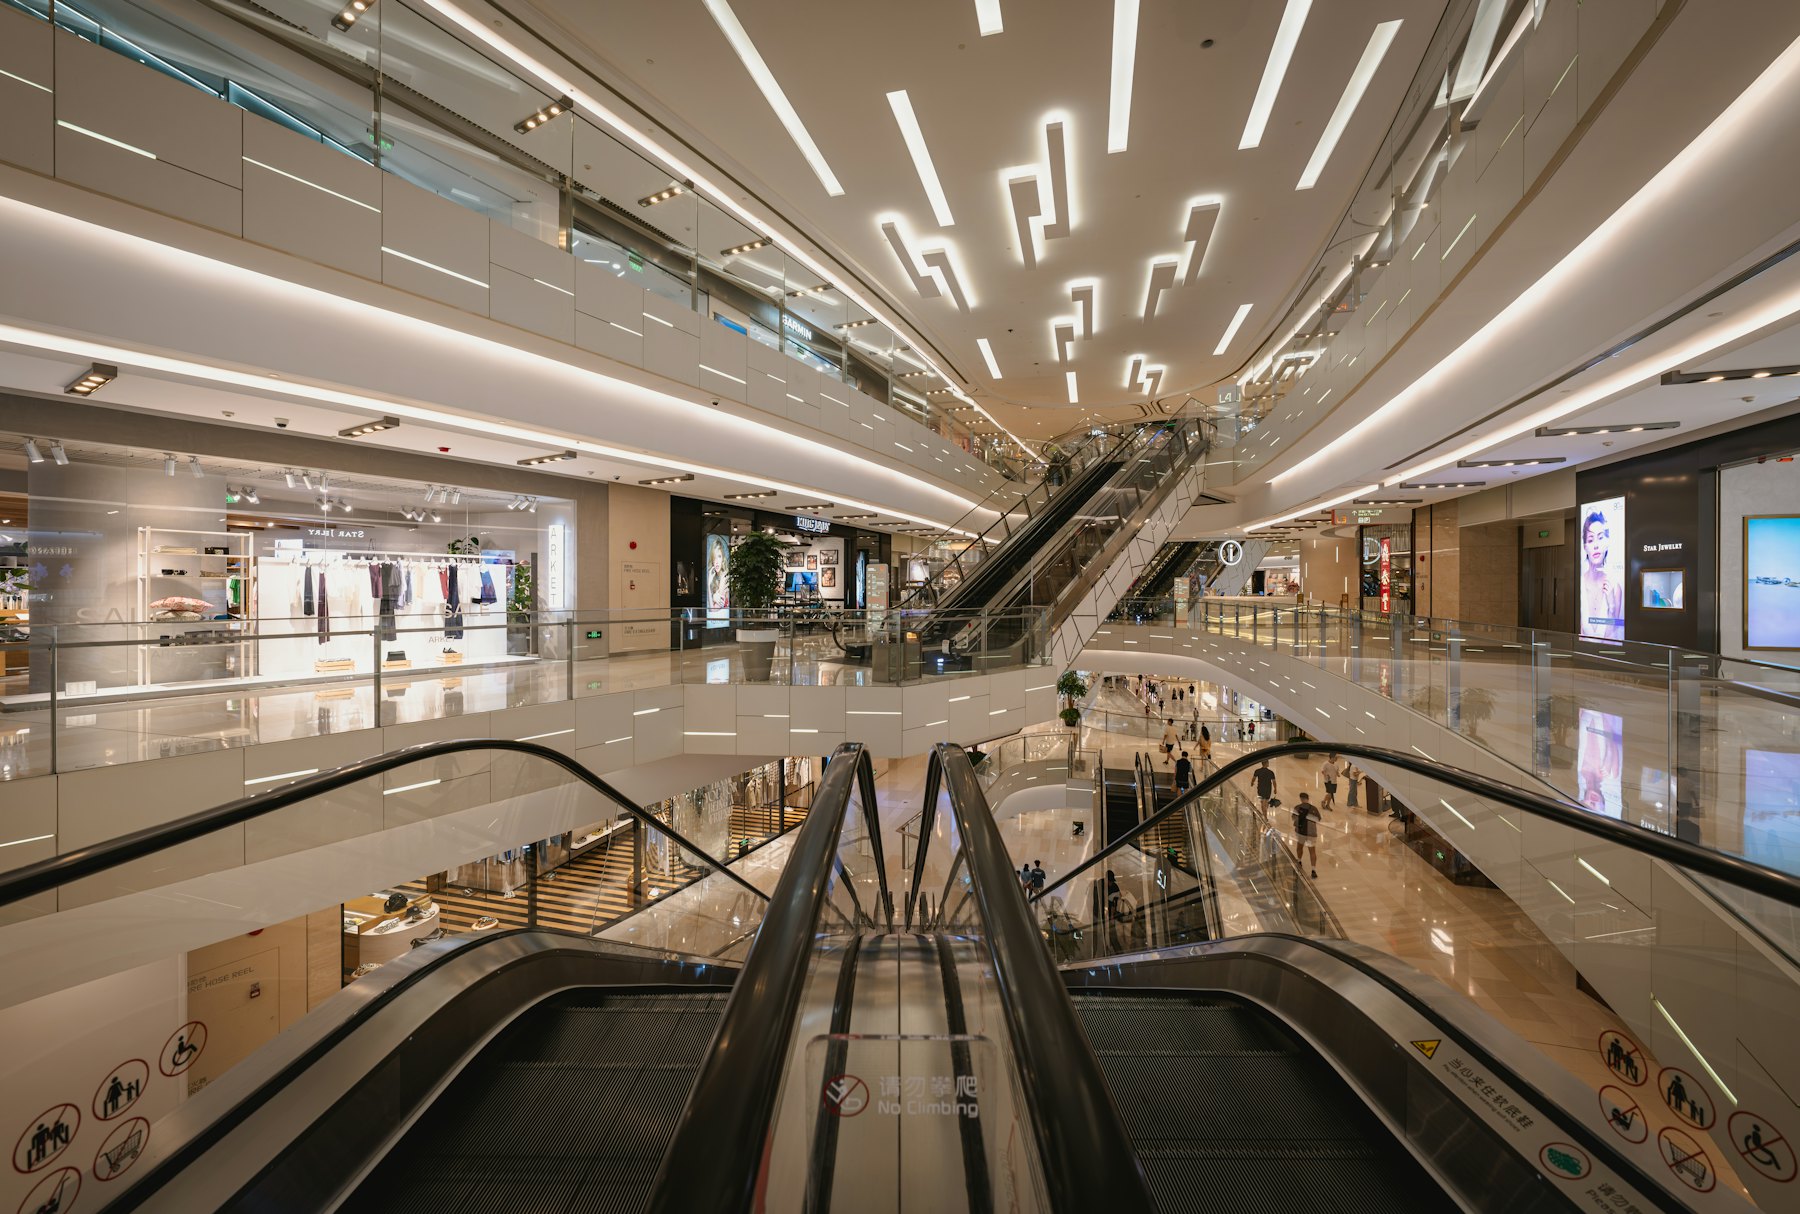

Live from participating retailers across AU











The Retail Score Index is compiled directly from the systems retailers already run — POS, e-commerce and inventory — structured through the same retail data model that powers the tRS platform. It gives the industry a shared, trustworthy read on performance that no single retailer could produce alone.
Weekly
Participating retailers' data is processed and published every Monday evening, so the Index always reflects the week just gone — not a quarter-old survey.
Granular
Like-for-like sales sit alongside transaction volumes, average transaction value, discount depth, channel mix and gross profit — the measures that explain why performance moved.
Located
Results can be cut by national, state, region and postcode — including individual fashion precincts and shopping centres — not just a single headline number.
Like-for-like sales across Australia's fashion, footwear and accessories industry rose just 0.2% in July, as retailers leaned harder on discounting to move winter stock — eroding margin in the process. The figures below are drawn from the tRS Retail Index, reported by Ragtrader.
Volumes down 0.4%, offset by 0.8% growth in average transaction value.
The only channel to deliver meaningful growth in July.
Concessions also fell 1.9%; standalone stores managed +0.2%.
Original prices ran 5.2% higher, but discounting erased most of the gain — gross profit fell for the first time in over a year.
The tRS Retail Index now powers a regular data partnership with Ragtrader, giving the industry an ongoing, evidence-based read on fashion retail performance across Australia.
Ragtrader · Insights
High streets bolster fashion store sales
4 August 2026 · Powered by The Retail Score Index · Read the full article
Postcode-level insight
This is the latest instalment in an ongoing Ragtrader series built on the tRS Fashion Retail Index. While standalone stores grew just 0.2% nationally in July, Index data cut at postcode level tells a different story in a handful of established fashion precincts.
Paddington, Armadale and Fortitude Valley all significantly outperformed their surrounding retail catchments from January to July — evidence that shoppers are still seeking out a compelling in-person experience, even as the wider market stays soft.
"Well-curated high streets offer a broader experience — combining distinctive retailers, hospitality and an engaging local environment."
Source: Ragtrader, "High streets bolster fashion store sales," 4 August 2026, reporting on tRS Retail Score Index data.
Retailers, landlords and analysts all draw on the same Index — but each uses it to answer a different question about how fashion retail is performing.
Benchmark your own like-for-like sales, discounting and channel mix against the wider market — by category, region or precinct.
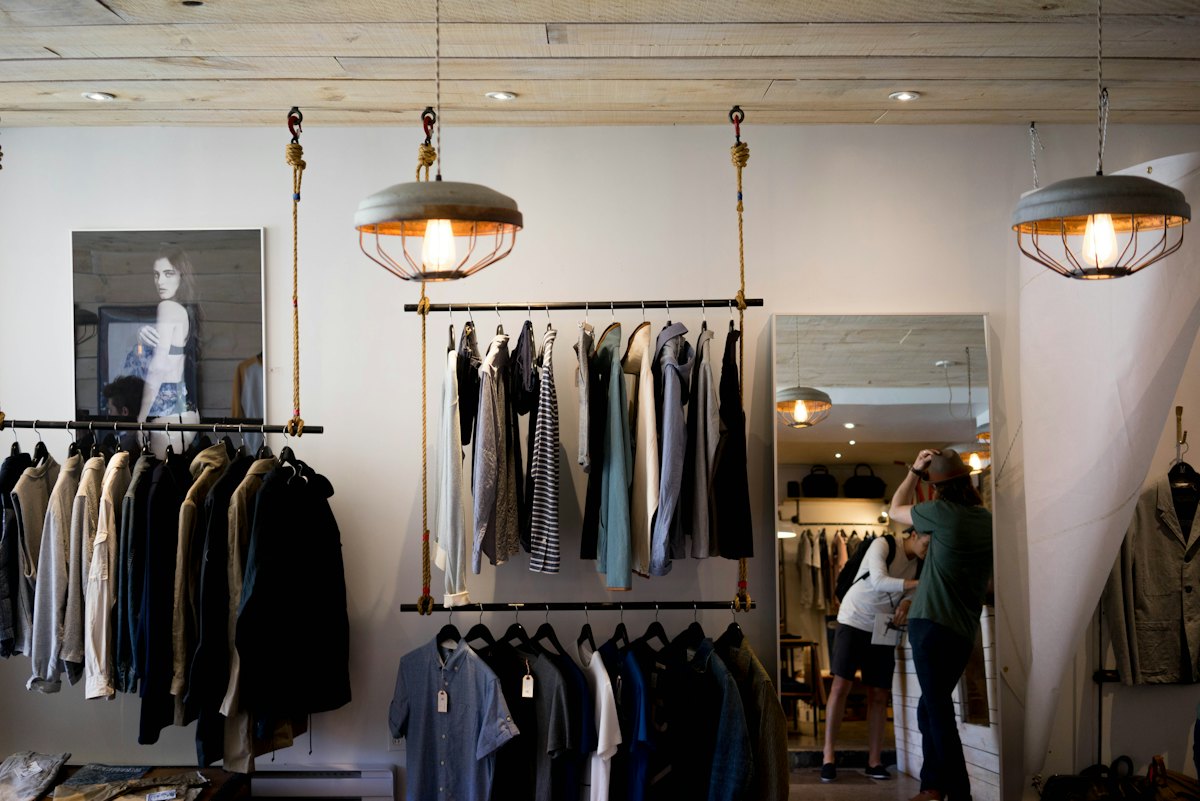
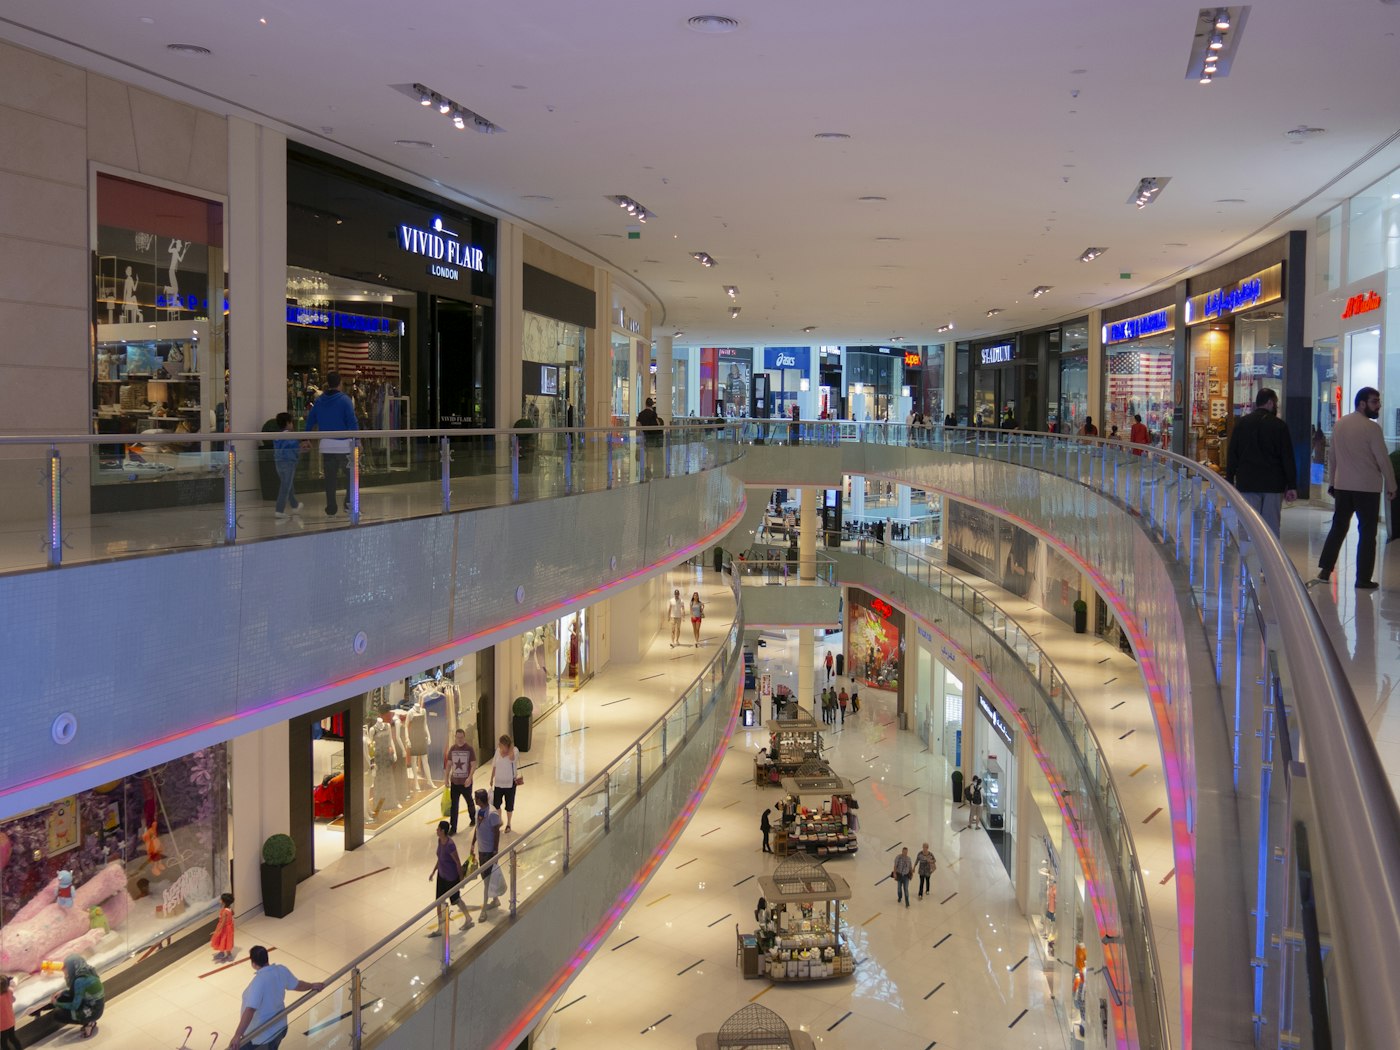
See how a centre or high street is performing against comparable retail catchments, down to postcode level.
Get an independent, data-backed read on fashion retail conditions, without waiting on quarterly reporting cycles.

Reference a consistent, weekly-updated industry benchmark — as used in the ongoing Ragtrader Index series.

The tRS Retail Index is open for retailers to participate in. Retailers who agree to share data get full benefit of the Index in return — data updated every Monday evening, across a broad range of measures and location segments, including postcode.
Share POS, e-commerce and inventory data through the same secure connection used by the tRS platform — no extra reporting work required.
Your performance is structured into the same retail data model as every other participant, so comparisons are consistent and like-for-like.
Receive a weekly read on how your stores and precincts are performing against the national and postcode-level Index.
Whether you're a retailer wanting to benchmark performance, a landlord tracking a precinct, or a journalist covering the industry — get in touch to talk through how the Index can work for you.