

Store Operations • Wage Optimization

Wage Optimization

Most retailers do not have a payroll problem. They have a labor alignment problem. The goal is not simply reducing hours — it is deploying labor more intelligently than last year.
Labor optimization without context creates the wrong behavior.
The best labor model is not the lowest payroll model. It is the highest-profit operational model.
What it is

The issue in plain language

Retailers already have payroll reports. The problem is that payroll reports rarely show the full operational picture. Labor performance is driven by traffic, conversion, sales mix, peak periods, operational workload, staffing quality, and historical demand patterns.
The solution

Improve labor productivity, not just payroll percentage

Wage optimization aligns labor investment to customer demand, traffic patterns, conversion opportunity, operational execution, and profitability. It helps teams understand whether they should reduce hours, rebalance hours, or add coverage where the opportunity justifies it.
Why last year matters

Labor optimization without
historical comparison is dangerous

A store may look overstaffed today, but traffic may be higher than last year. Or payroll percentage may look better, while conversion has declined because peak selling periods are now understaffed. Smart retailers optimize labor against demand patterns over time — not arbitrary payroll targets.
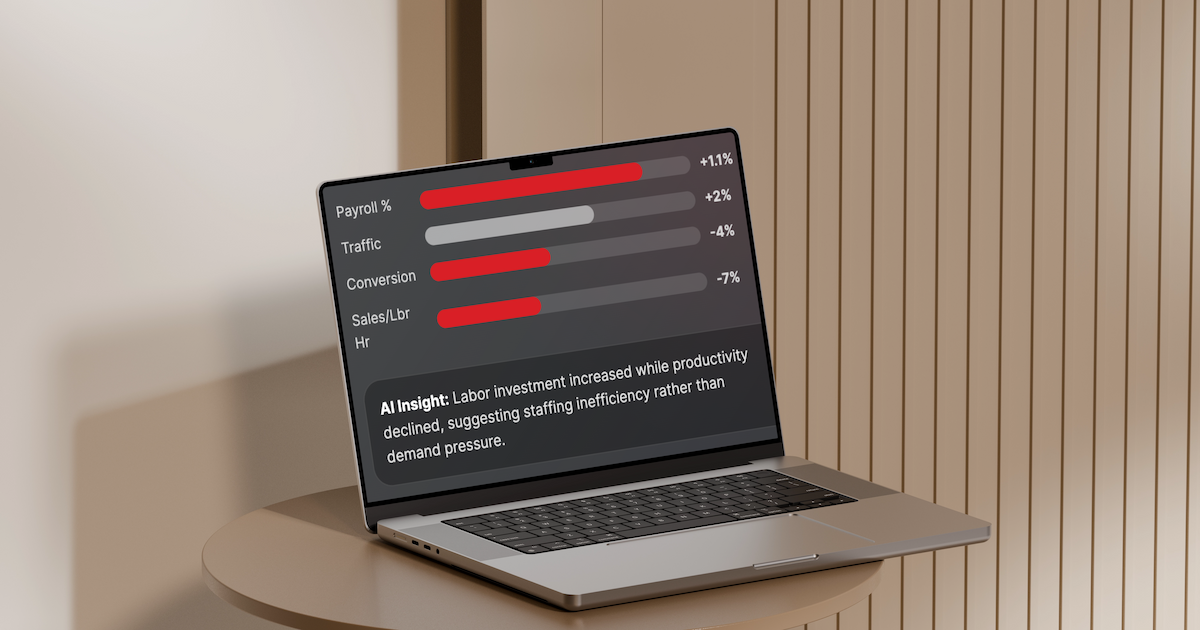
MetricThis YearLast YearChangeInterpretation
Payroll %14.2%13.1%↑ 1.1 ptsLabor cost increased
Traffic+2%BaselineSlightly upDemand does not explain full labor increase
Conversion-4%BaselineDownCoverage or selling execution may be misaligned
Sales / Labor Hour-7%BaselineDownProductivity drift requires action
Real-world patterns

What this looks like in a real apparel operation

Workflow

How the Store Team Score drives action

This is not just an individual metric. It is a repeatable way to make coaching, accountability, and improvement more specific at the person level.
Who should care
Why this matters by role
Metrics that matter
The wage optimization signal set
Payroll percentage is only one part of the story. The strongest view combines cost, productivity, customer demand, and operational output.
Why this matters financially
Small labor improvements create large operational leverage
The ROI is not just labor reduction. It is better alignment: fewer low-value hours, stronger peak coverage, higher productivity, and less management time spent diagnosing the same issues repeatedly.
Estimate Annual Payroll Opportunity
Annual sales
Payroll %
Prod. improvement %
Annual payroll base
$7.0M
Annual opportunity
$140K
This directional calculator estimates the value of improving labor productivity against the current payroll base. It does not include potential sales lift from better peak-hour coverage.
Workflow

How AI-driven wage optimization works

This page is not just about payroll control. It is about a repeatable method for aligning labor with demand, productivity, and execution.
Integrate
Combine payroll, scheduling, sales, traffic, conversion, and operational KPIs.
Compare
Compare labor performance to last year, prior periods, comparable stores, and expected demand curves.
Detect
Identify labor inefficiencies, productivity drift, overtime exposure, and peak-hour understaffing.
Diagnose
Explain what changed, where it changed, and likely operational causes.
Prioritize
Focus leadership attention on the largest opportunities and highest-risk stores.
Act
Rebalance labor, reduce low-value shifts, increase peak coverage, or correct overtime dependency.
Track
Measure productivity, payroll efficiency, conversion impact, and consistency over time.
Where AI helps

Use AI to move from payroll reports to operational action

Store-level focus
Explain it:
How has my labor productivity changed versus last year?
Find it:
Which shifts were least productive this week?
Balance it:
Where am I overscheduled or understaffed?
Protect it:
Did payroll reductions impact conversion?
Territory-level focus
Compare it:
Which stores have recurring labor inefficiencies?
Detect it:
Which stores are likely understaffed during peak periods?
Rank it:
Where is payroll increasing faster than sales?
Coach it:
Which stores need scheduling support first?
Executive-level focus
Trend it:
What is the chain-wide labor productivity trend versus LY?
Quantify it:
What is the estimated annual opportunity?
Segment it:
Which regions show worsening payroll efficiency?
Validate it:
Where can labor be optimized without damaging customer experience?
More 2-Minute Operational Insights

Continue the series

Explore other fast, practical issue pages built around the same pattern: signal, impact, workflow, and action.
Next up:

Store Score

Next up:
Product Overuse
Next up:
Overtime Drift
Next up:
Discount Leakage

Optimize labor intelligently — not blindly.

See where labor investment improves performance, damages conversion, creates inefficiency, or drives profitability using operational intelligence designed for retail.

Book a Demo